Review: SPSS 10.0

Developer: SPSS Inc.
Price: $999
Requirements: G3-based Mac with 64 MB of RAM, 150 MB of disk space, Mac OS 9.0.4.
SPSS is the market leader in heavy-duty desktop statistical analysis packages. The program the company is named for, SPSS, does most sorts of statistical analyses ordinary people are likely to know about, as well as a huge number of esoteric ones. It can also easily slice and dice data, generate random data, deal with weighted samples, and handle pretty much anything we can throw at it, except for high-quality graphics.
The first full version of SPSS to run on microcomputers was 4.0, and it ran on OS/2 and the Mac. That was also the last version to run quickly on Macs, with decent performance even on the 7.7 MHz Mac Plus (2 MB of RAM required). The next major release was 6.0, with a completely new user interface and heavy hardware requirements. The Windows version ran well enough, but the Mac version was slow and insanely buggy.
SPSS for the Mac Version 10, on the other hand, is a very good port by MacKiev, whose only drawback seems to be a long boot time (30 seconds on our beige G3). The interface had all the usual Macintosh screen elements, as well as excellent stability. SPSS looks and behaves exactly like a standard Mac program, and uses the standard Mac OS routines for printing, saving, etc. We tested the program on a beige G3 and an iBook, each with 128 megabytes of RAM and Mac OS 9. SPSS uses a lot of RAM, on any platform.
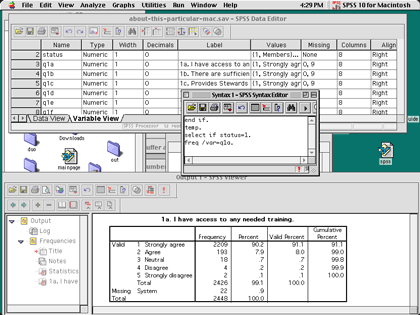
SPSS Workspace
If you forgive the relatively long boot-up time, and small delays in creating windows and some dialog boxes, SPSS 10 for Macintosh on a G3 266 performs at about the same speed as SPSS 10 for Windows on a Pentium III 400. In short, it’s a little bit slower than on a comparable Windows machine, but not by much.
The current version is a Classic application, but the company promises either an Cocoa or Carbon version, depending on what they can do with third-party components. That version may well be faster, given Mac OS X’s greater efficiency.
SPSS is designed for people who know something about statistics, with brief instructions that assume you understand the tests, or at least that you know statistical lingo. The menus are built differently depending on the options you have installed, with tests grouped together. It takes some experience to figure out exactly which tests go with which label, though the function names are more clear than in, say, MINITAB. (For example, Factor Analysis is listed by name under a “Data Reduction” submenu). The data, output, and syntax views also all have different sets of menus (as they do in Windows), so, for example, you have to be in the data window before you can use a menu to split the file.
Double-clicking on tables and charts in the output window (slowly) brings up a new editing sub-window, not unlike double-clicking charts in Excel or PowerPoint. New to SPSS is a dual-purpose data window; one view shows the data in spreadsheet form, where it can easily be viewed or changed, and the other view shows the variables in a list, along with variable and value labels. (SPSS allows you to provide descriptions for each variable, and for each value—for example, LOCATION can be called “survey location” and location 1 can be titled “Highland Park.”) This can be handy not just for changing variable attributes, but also as a way to remember what your variables are named and where they are. It is far better than the old method of double-clicking on a variable name in the spreadsheet view. However, we hope that in a future version, you can tab among all the views, instead of having separate windows for data, output, and input.
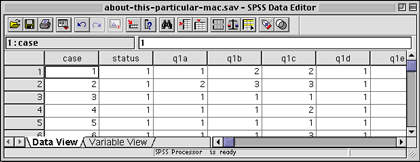
Spreadsheet View
“Syntax mode” operates like SPSS for mainframes, and provides powerful tools such as “temp/select if” and “do if” commands for quickly selecting one or two groups. Writing little programs in the syntax mode can save a great deal of time, and separates professional programs like SPSS from software which fills the needs of more casual researchers (e.g. StatView).
By typing in commands and then running them as a batch, the researcher can take advantage of commands that don’t work well as menus—such as temporary / select if—and can also save frequently used routines. For example, when running a linkage analysis to link employee survey data to customer or financial outcomes, I tend to run a number of regressions. It’s far faster for me to type in these commands than to trek repeatedly through the menus. Likewise, if I just want to see how employees in Kansas answered a given question, I can either go through the menus, select just employees in Kansas, and select a frequency count; or I can type
TEMP.
SELECT IF LOCATION=4.
FREQ /VAR=Q4.
Though it takes some time to learn the commands, most people tend to use the same commands over and over again. By clicking on PASTE—which is nearly always an option—rather than OK, the user can tell the program to write the command into the syntax window rather than running it.
Using syntax can also save a lot of time for people who frequently use options different from the defaults. While the menus aren’t too clumsy, simply typing the commands is a major timesaver. Fortunately, unlike some competitors—MINITAB comes to mind—SPSS’ syntax is generally consistent and easy to understand. Commands are run simply by pressing Command-R, by selecting Run from a menu, or by pressing a toolbar icon. An optional book (which I strongly recommend you buy as soon as you get the program) lists the syntax for each command, with all options.
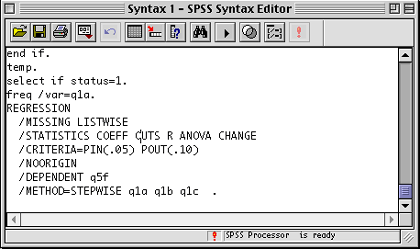
Syntax Regression
Output is moderately customizable, and you can use and save different formats for line and cell formats. The user does not have full control, though; for example, frequency counts always come with cases, total percent, valid percent, and cumulative valid percent.
I would like to be able to change table formatting via syntax—indeed, more control over table formatting, in general, would be very helpful. Modifying SPSS-generated tables can be fairly slow, due both to the interface and to a sizable delay in opening tables for editing, on both Mac and Windows. Still, the results are better than in the past, and the controls are improving.
Pivoting trays make it easy to change the way tables are printed; rows can become columns, for example, and layers can be made into rows or columns very easily. Anything can be switched to another place. Only a few commands (including REPORTS and LIST CASES) still produce old-fashioned, space-formatted, typewriter-font output. Since the REPORTS command is very useful, I hope they get around to converting all the commands to clean, tab-delimited output.
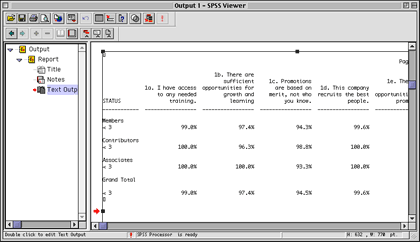
Ye Olde Report
Charts, like tables, can be customized, and various formatting options can be saved as a chart style. While the chart function is a bit slow, the defaults poorly chosen, and the formatting clunky, these flaws are overcome by the useful abilities of saving chart formats and specifying some options in syntax. Someday, we hope to find a charting program or function as easy to use as Cricket Graph 1.3—which was sold with SPSS 4 back in the 1980s.
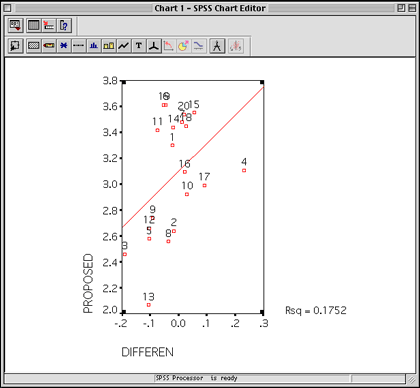
Scatter Plot
In SPSS 10 for Macintosh, charts can be saved as GIF images for publishing on the Web, and can be copied and pasted into other programs. The tables can also be easily pasted into spreadsheets or word processing programs. Those who are still using SPSS 4 may find this alone to be worth the upgrade. (Some output, such as the Reports, are still in plain text, separated by spaces).
Most people will probably export SPSS tables and charts to other programs for publication, but at least SPSS 10 makes this easier than did previous versions. A little polishing of the output would go a long way to letting people use SPSS alone, without having to resort to Excel or charting programs.
SPSS 10 data files, which are highly compressed to save disk space, are compatible with previous Mac and Windows versions. The program can read and save to a large variety of formats, including tab-delimited text, plain ASCII text (where columns are defined by the user and are not separated at all), and Excel. Syntax files can be shared across platforms, or edited in word processors (they are plain text). Output files can be saved as HTML. SPSS also sells programs which allow other people to view the results and delve deeper into the data.
Like all prior versions of SPSS, variable names can only be eight characters long, generally with just letters, numbers, and underscores. Labels can easily be added, either via the variable view or with the VARIABLE LABELS command. Likewise, each value (e.g. 1 or 2) can be assigned a label, so that instead of seeing a frequency for VAR1 with 22% value 1, you can see a frequency for Cat Breeds with 22% Domestic Short Hair. This makes it much easier to deal with the output; to copy and paste output into presentations or reports without having to retype everything; and, most important, to actually know what is in the file a year later when you’ve lost your notes. On the other hand, it would be nice if SPSS would allow hyphens in variable names, not to mention names with more than eight characters.
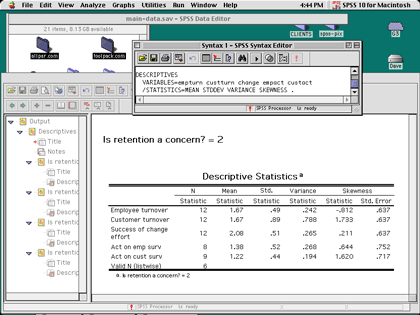
Split File in Action
Dividing and subdividing data sets is fairly easy with commands such as Split File and extensive reporting features. Split File lets you sort results by a variable (or several variables); for example, running any test or description separately on each location in a survey, using a single command. This can be a real time-saver, and it makes complicated slice-and-dice analyses much easier than, say, MINITAB. Unfortunately for those who use SPSS for survey data, string variables are still limited to 256 characters; otherwise, SPSS would be a terrific survey reporting package.
SPSS is sold as a base program with optional modules, all of which are available for the Mac. Between the base program and the modules, a huge number of analyses, tests, and statistics can be generated, most of them with ease. The company’s Web site provides details on what each module does, an important consideration before buying. (When upgrading, the user must pay for upgrades on each module they use as well as on the base program). Some specialized statistics, however, can only be generated using non-SPSS software which is sold in other packages by SPSS (for example, a new program for dealing with very small samples).
Given the breadth of SPSS, it is nearly impossible to go into any depth on its statistical features. However, we can generally say that its statistical range is comprehensive, and that it becomes easier to use as one gets used to the syntax. The program is fairly quick if given the memory it needs, and can handle large data sets without problems—though the view of the actual data in spreadsheet mode can be rather slow (this is also true under Windows). It works well with Excel, and is flexible in many ways.
It’s no surprise that SPSS is the dominant player in the statistics market—especially since they have a habit of buying competitors. I only hope that they continue to support the Mac, and that they bring some of their other programs over as well.
Reader Comments (17)
Me diò mucho gusto saber que existe este programa estadistico, empieso a aprender a utilizarlo, creo que me serà de utilidad.
Jesus Villanueva Vela
I did not even know that there was an SPSS Student 7.
PS: Version 11 is out soon. I'll be getting it in January and reviewing it for the January or February issue. Also, I think Jesus Villanueva was saying he likes it, too!
There are always improvemetns in new versions; there are usually also slowdowns and increased memory requirements. OSX 10.3 is the only exception I know of to this rule!
Add A Comment